

Explore user tracking software to map user journeys and optimize conversion paths fast.
Modern growth strategy requires moving past surface-level vanity metrics. High-performing digital teams go beyond knowing how many visitors land on a page; they focus on understanding why those visitors convert, drop off, or abandon their carts.
This requires user behaviour tracking software. In fact, marketing organizations like Potens Digital use advanced user behaviour analytics tools to get high-yield channels because they can directly trace user intent to revenue outcomes.
Additionally, data from Forrester Research indicates that optimizing customer experience through targeted user behaviour tracking tools can increase conversion rates by up to 400%.
Whether you are scaling an e-commerce platform, optimizing a B2B SaaS onboarding funnel, or managing regional sites across the Canadian market, choosing the right website user tracking tools is essential.
We have evaluated the best user behaviour tracking tools available today, complete with key features, pricing, integrations, and real-world implementation strategies to enhance your marketing ecosystem.
What is User Behaviour Tracking?
User behaviour tracking involves collecting, aggregating, and analyzing quantitative and qualitative actions taken by visitors across digital touchpoints. Unlike traditional web analytics that count pageviews and bounce rates, customer behaviour tracking tools map micro-interactions, including click coordinates, scroll depth, form field drop-offs, mouse hover patterns, and feature adoption trajectories.
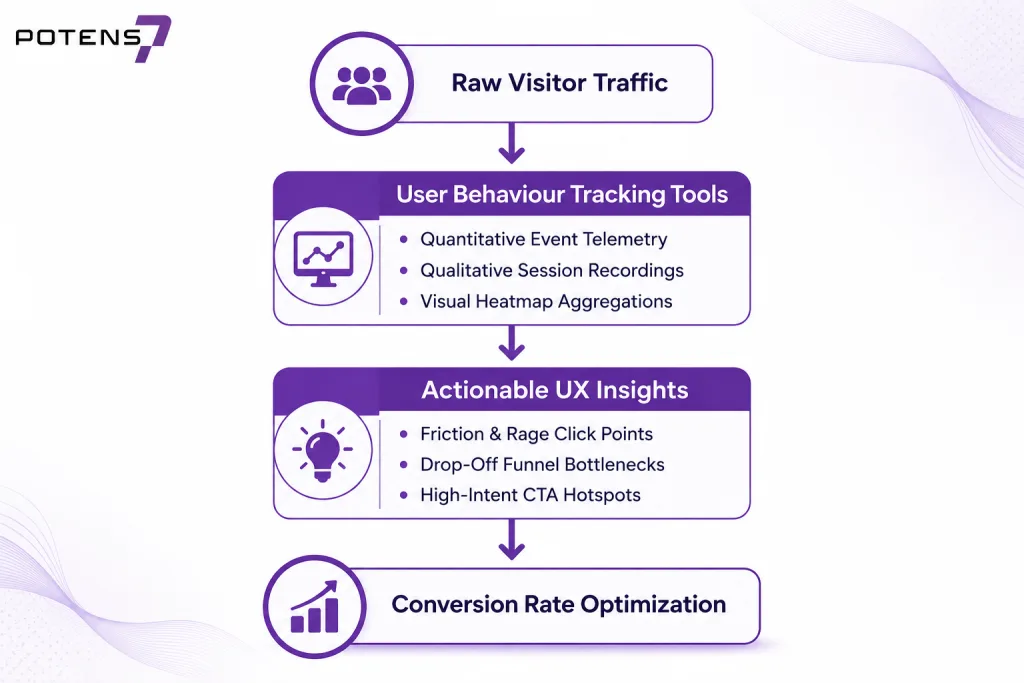
By using user tracking tools for marketers, teams transform raw behavioural data into actionable insights. This enables precise conversion rate optimization (CRO), tailored customer journey mapping, and improved customer experience (CX) across all digital touchpoints.
Core Types of User Behaviour Analytics Data
To build a holistic view of the user journey, digital marketers rely on three primary categories of website analytics tools:
- Quantitative Event Data – Captures discrete user interactions such as button clicks, file downloads, video plays, and custom API events. These metrics fuel funnel analysis, cohort retention modelling, and conversion tracking.
- Qualitative & Visual Data – Delivered through session recording replays and aggregate heatmap visualization (including click, movement, and scroll maps). These reveal friction points like rage clicks, dead clicks, and layout confusion.
- Attitudinal Data – Sourced from micro-surveys, net promoter score (NPS) prompts, and exit-intent feedback overlays. This data provides immediate context on why a user abandoned a form or dropped out of a conversion flow.

Your Digital Growth Partner
Make Privacy Part Of Tracking!
Effective behaviour tracking should never come at the expense of customer trust. Build privacy into analytics with PII masking, clear data governance, consent controls, and compliant data handling from the start.

8 Best User Behaviour Tracking Tools – In-Depth Breakdown
1. Contentsquare (with Integrated Hotjar)

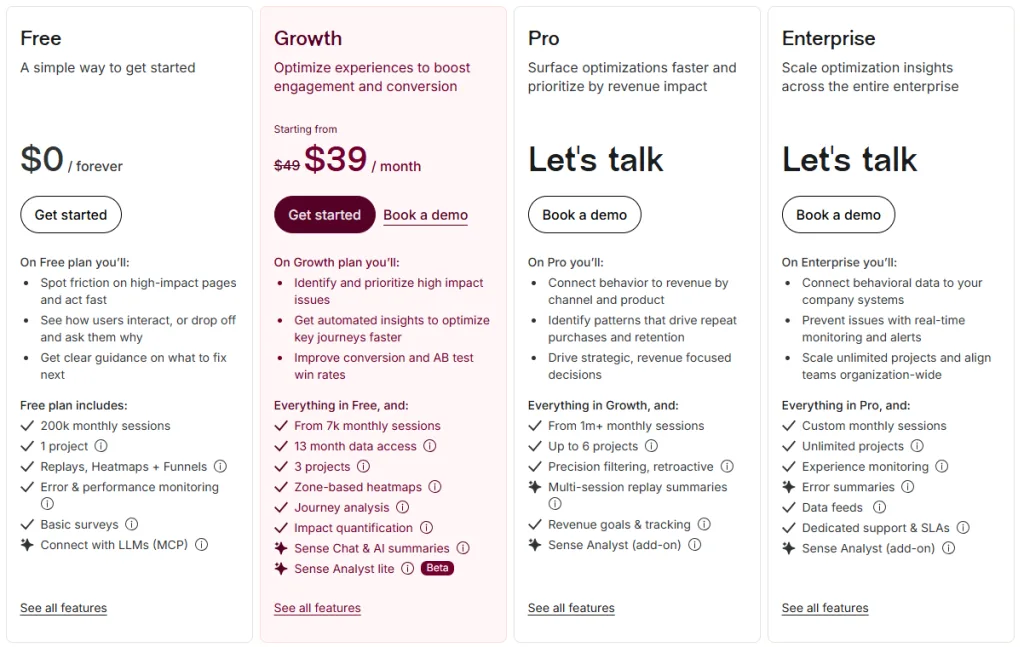
Contentsquare is an enterprise-grade experience intelligence platform. Following its acquisition and integration of Hotjar, it offers a unified solution that combines quantitative event tracking, zone-based heatmaps, and AI-driven friction detection.
| Contentsquare Experience Engine | |
|---|---|
| Contentsquare Enterprise | Hotjar Observe |
| Zone-Based HeatmapsRevenue AttributionAI Sense Insights | Quick-Deploy ReplaysOn-Page SurveysMicro Feedback Loop |
Key Features
- Zone-Based Heatmaps – Quantifies the financial value of every layout element by showing revenue generated per click.
- AI-Powered Sense Engine – Automatically flags anomalous user frustration signals, including rage clicks and broken page elements.
- Merger Synergies – Seamlessly combines Hotjar’s qualitative survey capabilities with Contentsquare’s enterprise analytics pipeline.
G2 Review Highlight
“I really appreciate Hotjar by Contentsquare for understanding click and scroll heat maps. The session recordings are valuable for analyzing web pages and user behaviour. I find implementing on-page survey widgets very valuable for gathering user feedback. I like how the session recordings and instant feedback widgets work together, especially with heat maps and URL-based filtering. The heat maps, session recordings, and survey widgets are very valuable to me. Setting it up via Google Tag Manager was pretty straightforward, and their support was exceptional.”
Quantitative Summary
- Ratings – G2 – 4.4/5 (2000+ reviews) | Capterra – 4.8/5
- Pricing – Free tier available for legacy Hotjar Observe (up to 35 daily sessions). Contentsquare Enterprise starting plans range from $30,000 to $80,000+/year based on monthly session volumes.
- Integrations – Salesforce, Google Analytics 4, Adobe Analytics, Shopify, Optimizely, Dynamic Yield.
Pros & Cons
- Pros – Unmatched enterprise attribution depth; auto-captures all page interactions without requiring manual tagging.
- Cons – Enterprise tier pricing requires custom quotes; setup complexity demands dedicated tag management resources.
2. Mixpanel
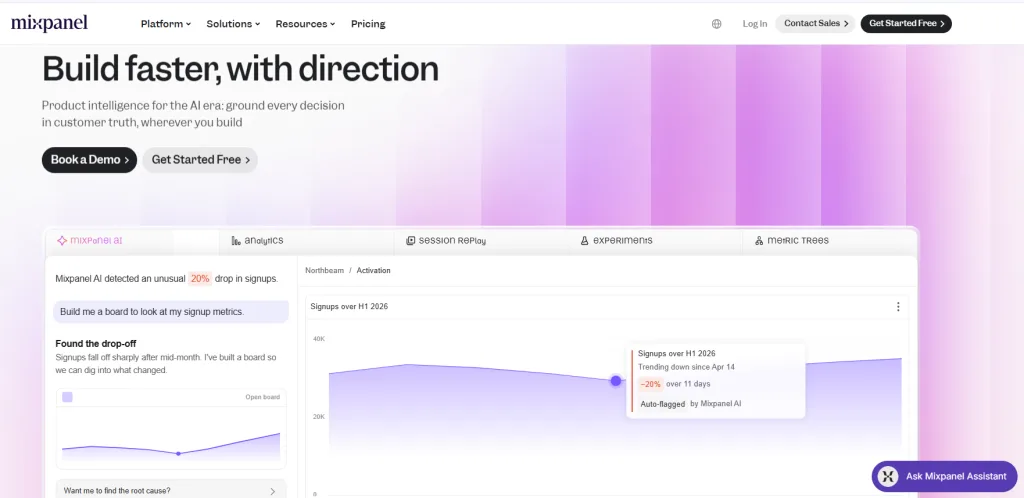
Mixpanel is an event-based product analytics platform designed to analyze user retention, conversion funnels, and feature usage across web and mobile applications.
Key Features
- Interactive Funnel Analysis – Identifies drop-off stages in real time with granular multi-property filtering.
- Group Analytics – Tracks account-level metric trends for B2B accounts alongside individual user profiles.
- Signal & Impact Analysis – Measures how adopting specific features correlates with long-term user engagement and retention.
TrustRadius Review Highlight
“It is a fantastic tool for any workgroup; it helps promote better organization among team members, ensures smoother communication, facilitates information sharing and distribution, and improves team efficiency. It is easy to use and navigate; no extensive training is required to use it properly. Its chat function is easy to use; connecting with other people is no longer a problem, and the communication gap has disappeared. The functionality to schedule and update calendars to our liking is a great success of this software. Everything goes quite well with Mixpanel; besides, its team constantly keeps innovating and solving things.”
Your Digital Growth Partner
Connecting CRM Data To Web Interactions
HubSpot links live visitor activity directly to contact timelines, empowering sales teams to personalize outreach based on the exact product pages and features prospects review.

Quantitative Summary
- Ratings – G2 – 4.5/5 (1,300+ reviews) | Capterra – 4.5/5
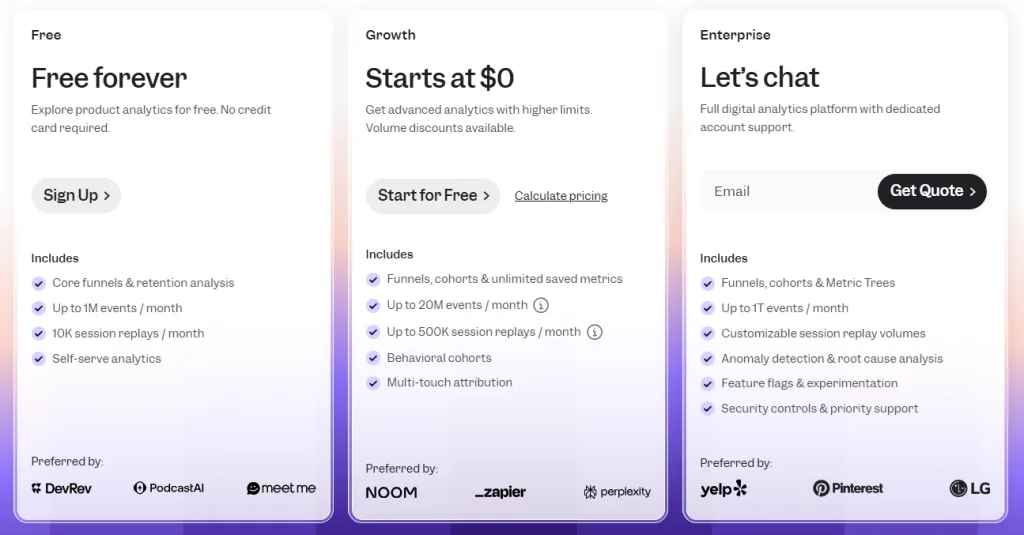
- Pricing – Free forever plan includes up to 20M monthly events. Growth plan starts at $0/month (billed annually for 10K MTUs). Enterprise tiers feature custom volume pricing.
- Integrations – Snowflake, BigQuery, Segment, RudderStack, HubSpot, Zapier.
Pros & Cons
- Pros – Lightning-fast query engine; scalable free tier for growing startups.
- Cons – Does not offer native session replays; requires a well-structured data taxonomy during setup.
3. Microsoft Clarity
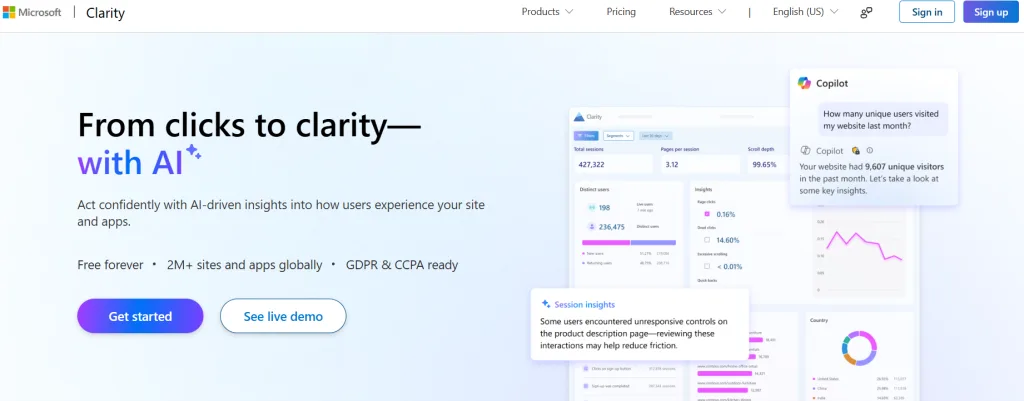
Microsoft Clarity is a free, GDPR-compliant user behaviour analytics software that provides session replays and scroll heatmaps without sampling caps or site traffic limits.
| Microsoft Clarity Engine | |
| Core Feature Module | Key Capability / Details |
| Session Replays | Zero Session Capture Limits |
| Scroll Heatmaps | Unlimited Aggregations |
| Frustration AI | Rage Click & Dead Click Tags |
Key Features
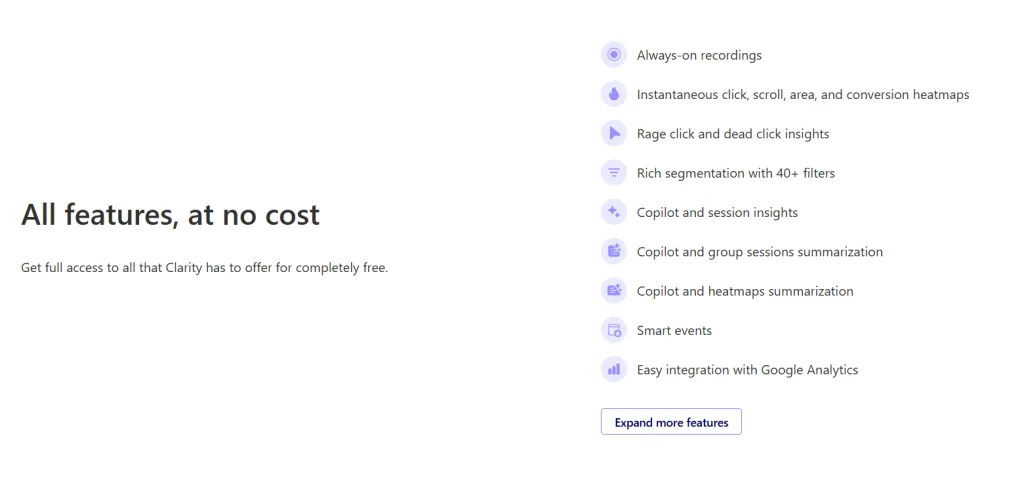
- Unlimited Session Recordings – Captures user sessions with no volume limits or artificial session throttling.
- Automated Frustration Insights – Automatically tags recordings containing rage clicks, dead clicks, quick backs, and excessive scrolling.
- Google Analytics 4 Co-Pilot – Integrates directly with GA4 to attach Clarity session replays to standard conversion reports.
Capterra Review Highlight
“My overall experience with Clarity is good. The variety of reporting metrics gives me insights about my website, which helps me improve my Product, SEO and overall strategy.”
Quantitative Summary
- Ratings – G2 – 4.5/5 (60+ reviews) | Capterra – 4.8/5
- Pricing – 100% Free Forever with no traffic caps or hidden upsells.
- Integrations – Google Analytics, Shopify, WooCommerce, WordPress, Google Tag Manager.
Pros & Cons
- Pros – Completely free; quick installation via GTM; zero impact on core page load times.
- Cons – Lacks predictive behavioural cohorting and native A/B testing modules.
4. Amplitude
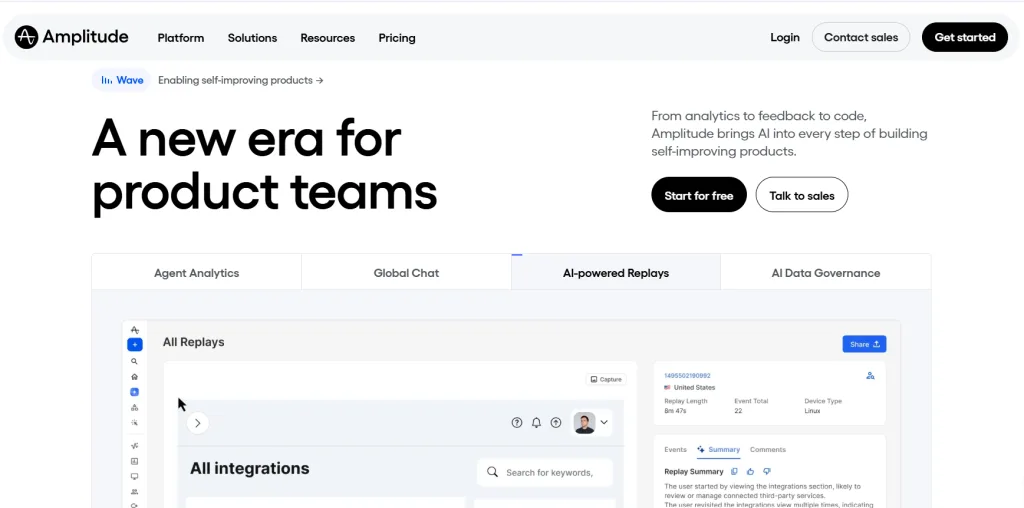
Amplitude is a product analytics and digital optimization engine built to analyze customer retention, run predictive behavioural cohorting, and map end-to-end user journeys.
Key Features
- Behavioural Cohorting – Groups users based on specific actions (e.g., users who read three blog posts before subscribing) to evaluate retention impacts.
- Predictive Analytics – Employs machine learning algorithms to predict churn risks and conversion likelihood.
- Amplitude Experiment – Combines behavioural data with native A/B testing capabilities.
G2 Review Highlight
“I really like how Amplitude Analytics keeps the event specs and code in sync, making it simpler to work with the Analytics Team. It makes sure no information is missed when an analyst creates an event, as all necessary details are automatically synced into the codebase. This effectively bridges the gap between analysts and software engineers, eliminating the need for manual synchronization of event specifications.”
Quantitative Summary
- Ratings – G2 – 4.5/5 (3,800+ reviews) | Capterra – 4.6/5
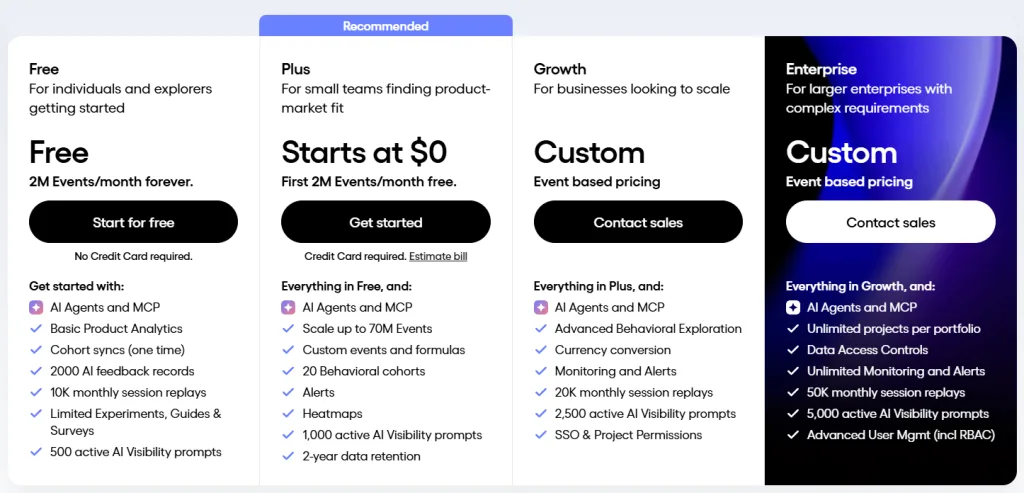
- Pricing – Starter plan is Free (up to 2M events/month). Plus and Growth plans feature custom volume-based pricing.
- Integrations – Salesforce, Marketo, Snowflake, Amazon S3, Segment, Braze.
Pros & Cons
- Pros – Advanced analytics engine; excellent support for cross-platform app tracking.
- Cons – Steeper learning curve for non-technical marketing roles.
5. Crazy Egg
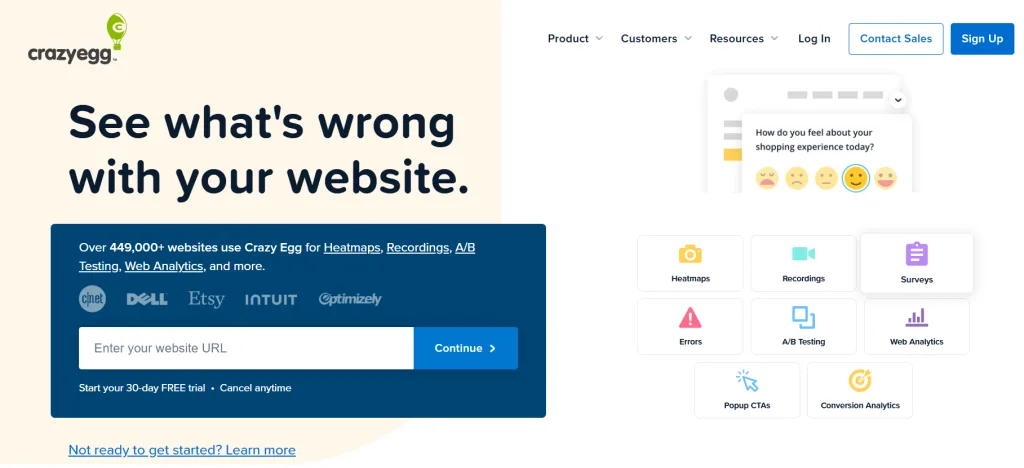
Crazy Egg was an early pioneer in website user tracking tools. It offers snapshot visual reports, scroll-depth mapping, and a lightweight A/B testing engine for quick visual optimizations.
Key Features
- Confetti & Snapshot Reports – Displays user clicks broken down by referral channel, device type, country, and browser parameters.
- Overlay & Scroll Maps – Shows exact page percentages reaching key call-to-action (CTA) buttons.
- Built-in WYSIWYG Editor – Allows marketers to run simple layout tests without developer resources.
TrustRadius Review Highlight
“Crazy Egg helps us to visualize the areas of our website where users click the most. It helps us to know what users are interested in most on our website. Crazy Egg helps us to know where our users come from. It also gives us an idea of what section of our website is being interacted with most by our users. This is crucial business intelligence required to improve the effectiveness of our website.”
Quantitative Summary
- Ratings – G2 – 4.2/5 (100+ reviews) | Capterra – 4.4/5
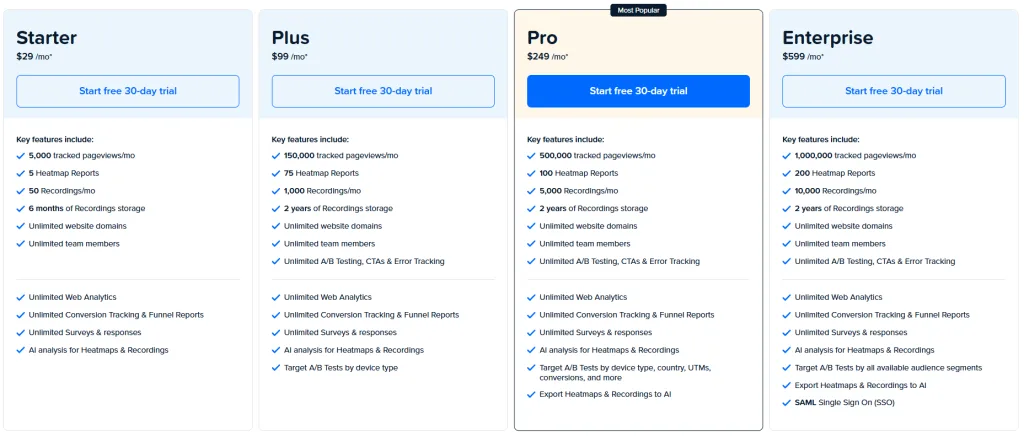
- Pricing – Standard tiers start at $29/month (Standard) up to $249/month (Pro); enterprise tiers available upon request.
- Integrations – Shopify, WordPress, Wix, Drupal, Google Tag Manager.
Pros & Cons
- Pros – Simple visual reporting setup; easy creation of landing page split tests.
- Cons – Limited event-based product tracking features compared to Mixpanel or Amplitude.
6. PostHog
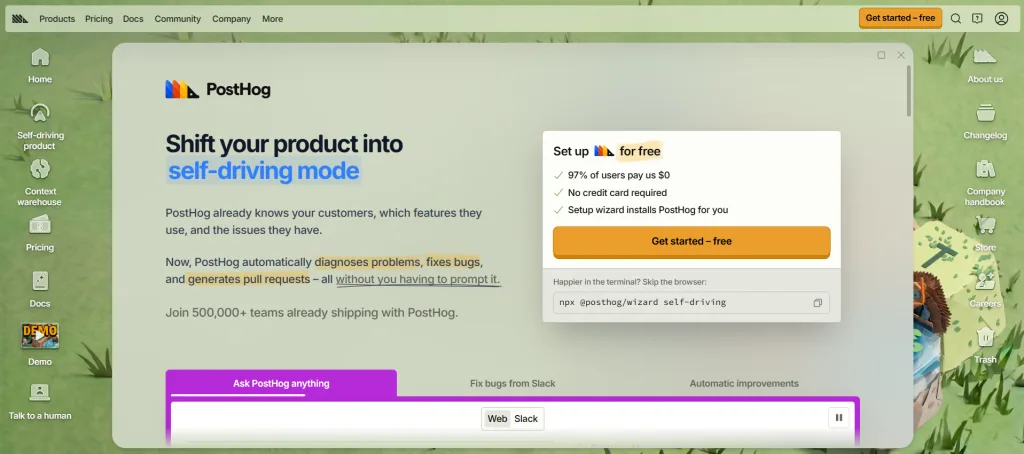
PostHog is an open-source product analytics suite that provides event tracking, session recordings, feature flags, and A/B testing within a single self-hostable or cloud-managed platform.
| PostHog All-In-One Platform | |
|---|---|
| Core Feature Module | Key Capability / Details |
| Event Analytics | Custom event telemetry, funnel tracking, and retention analysis |
| Session Replays | Visual user session recordings with privacy controls and frustration tagging |
| Feature Flags | Phased rollouts, multivariate targeting, and instant kill switches |
| Native A/B Tests | Statistical experimentation tied directly to behavioural analytics |
Key Features
- Integrated Feature Flags – Triggers unique UX states based on user behavioural segments and live cohort rules.
- Autocapture Capabilities – Records website click events and form fills automatically without requiring manual tag configuration.
- Self-Hosting Privacy Options – Can be deployed locally via Docker or Kubernetes to maintain full privacy compliance.
G2 Review Highlight
“PostHog is one of the most useful tools for understanding what users actually do inside a product. I really like that analytics, funnels, session recordings, feature flags, experiments, surveys, and dashboards are all connected in one place, rather than being split across several different tools. The session replay feature is especially valuable because it lets us observe real user behaviour, spot friction points, and better understand where and why users drop off. It also makes product and marketing decisions much easier, since we can tie user actions to clear data instead of relying on guesswork. Overall, PostHog provides a very complete view of the customer journey and helps teams iterate and improve the product faster.”
Quantitative Summary
- Ratings – G2 – 4.5/5 (1000+ reviews)
- Pricing – Cloud Free tier includes 1M events & 5K recordings per month. Paid usage uses pay-as-you-go pricing (starting at $0.00031/event).
- Integrations – Sentry, Slack, Zapier, Segment, Google BigQuery.

Pros & Cons
- Pros – Transparent pay-as-you-go pricing; developer-friendly open-source architecture.
- Cons – Technical interface can feel complex for pure content marketing roles.
7. Google Analytics 4 (GA4)
Google Analytics 4 serves as a core foundational tool for overall web traffic tracking, channel acquisition mapping, and conversion event monitoring.
Key Features
- Event-Driven Telemetry Model – Tracks interactions using flexible event parameters rather than session-based structures.
- Predictive Audiences – Uses Google’s machine learning to highlight churn probabilities and potential revenue segments.
- Native Google Ecosystem Links – Connects seamlessly with Google Ads, Search Console, and BigQuery.
TrustRadius Review Highlight
“I analyze the website’s performance and user flows for events and program sales. Google Analytics helps me detect the best channels to advertise our services and create a promotional strategy. Also, I work a lot with the website user experience, and Google Analytics is very helpful for understanding how users react to different types of content and whether they understand descriptions and instructions.”
Quantitative Summary
- Ratings – G2 – 4.5/5 (6,000+ reviews)
- Pricing – Standard version is Free. GA360 enterprise contracts start around $50,000/year.
- Integrations – Full Google Cloud Suite, Looker Studio, Salesforce, Shopify, HubSpot.
Pros & Cons
- Pros – Industry-standard tracking engine; deep integration across paid acquisition platforms.
- Cons – Missing qualitative visual tools like session replays and heatmaps out-of-the-box.
8. HubSpot (Marketing Hub)
HubSpot links individual website user tracking tools directly to a centralized CRM. This gives growth teams a complete real-time view of every marketing-qualified lead’s conversion path.
Key Features
- Closed-Loop CRM Attribution – Links specific webpage visits, form completions, and content downloads to deal stages.
- Automated Behavioural Workflows – Triggers targeted email sequences based on specific website interaction criteria.
- Contact Timeline Visualizer – Displays a complete list of every page touchpoint associated with a customer account.
G2 Review Highlight
“Super happy with HubSpot Marketing Hub. Lead generation has improved and a lot of time has been saved courtesy of the AI automation features without compromising on quality.”
Quantitative Summary
- Ratings – G2 – 4.4/5 (10,000+ reviews) | Capterra – 4.5/5
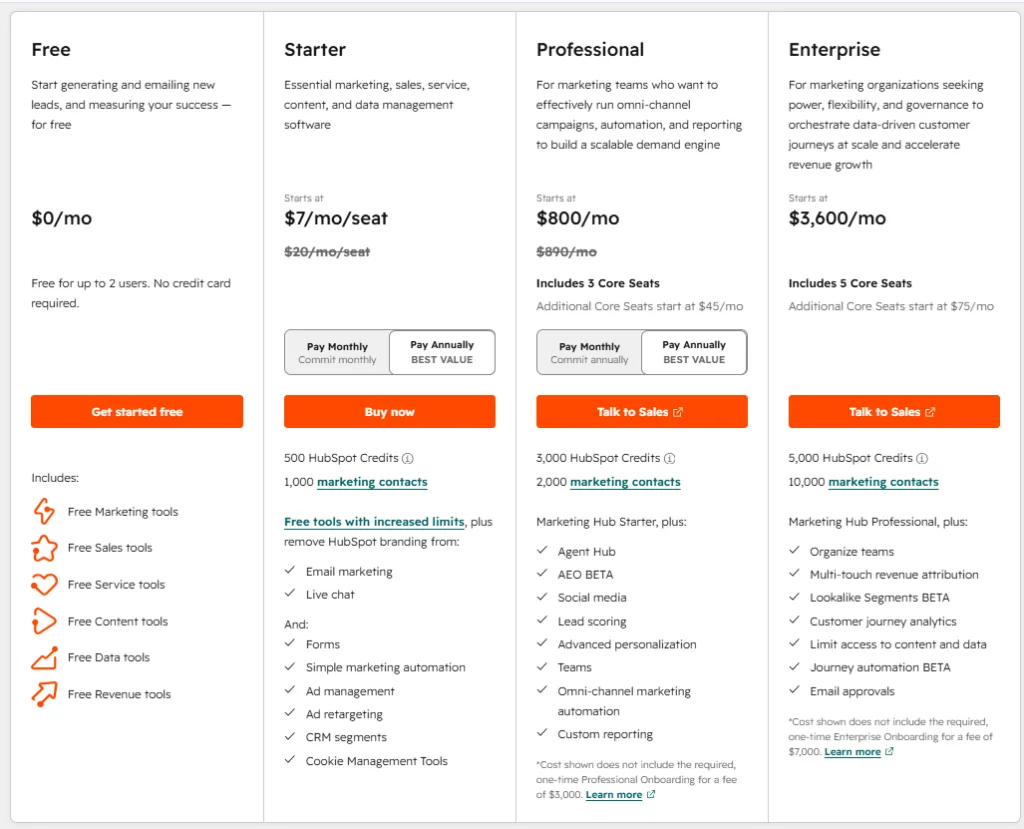
- Pricing – Free tools available. Paid Marketing Hub tiers range from $7/month/seat (Starter) up to $3,600/month (Enterprise).
- Integrations – Salesforce, WordPress, Google Ads, Zapier, Shopify, Zoom.
Pros & Cons
- Pros – Directly connects web activity to revenue pipelines; powerful automation engine.
- Cons – Advanced reporting metrics require upgrading to higher-tier plans.
User Behaviour Tracking Tools Comparison
| Platform | Primary Focus | Free Tier | Entry Paid Tier | Best For |
| Contentsquare | All-in-One Experience Intelligence | Free Observe (Hotjar) | ~$30,000/yr (Custom) | Enterprise E-Commerce & CRO |
| Mixpanel | Product & Event Analytics | 20M events/mo | $20/mo | Event-Based Funnels & Retention |
| Microsoft Clarity | Session Replays & Heatmaps | Unlimited Free | Free Forever | Unlimited Replays & Quick Audit |
| Amplitude | Behavioral Cohorting | 10M events/mo | Custom Pricing | Advanced Product & Growth Teams |
| Crazy Egg | Visual Click & Scroll Maps | 30-Day Trial | $29/mo | Quick Visual CRO Experiments |
| PostHog | Product Analytics & Flags | 1M events/mo | Pay-as-you-go | Open-Source & Privacy Compliance |
| Google Analytics 4 | Web Traffic & Acquisition | Unlimited Free | GA360 ($50k/yr) | Baseline Traffic & Channel Tracking |
| HubSpot | CRM-Linked Web Activity | Free Core CRM | $15/mo/seat | Inbound Lead Generation & B2B |
Privacy-First Platform Options & Compliance
Modern behavioural tracking requires strict privacy compliance, especially with regulations like GDPR, CCPA, and Canada’s PIPEDA.
- PII Masking & Suppression – Platforms like Microsoft Clarity, Contentsquare, and Hotjar automatically obscure sensitive form input fields (e.g., credit card numbers, passwords, address lines) on the user’s browser before session data reaches remote storage.
- First-Party Data Collection – To maintain tracking precision despite third-party cookie deprecation, tools like Mixpanel and PostHog process data through first-party proxy setups, ensuring analytics remain accurate and compliant.
- Self-Hosted Infrastructure – Organizations targeting strict data sovereignty compliance across the Canadian market can opt for self-hosted instances of PostHog. This keeps all collected user data on local cloud servers (such as AWS Canada) without transmitting information across international borders.
Case Study – Optimizing a B2B SaaS Onboarding Flow
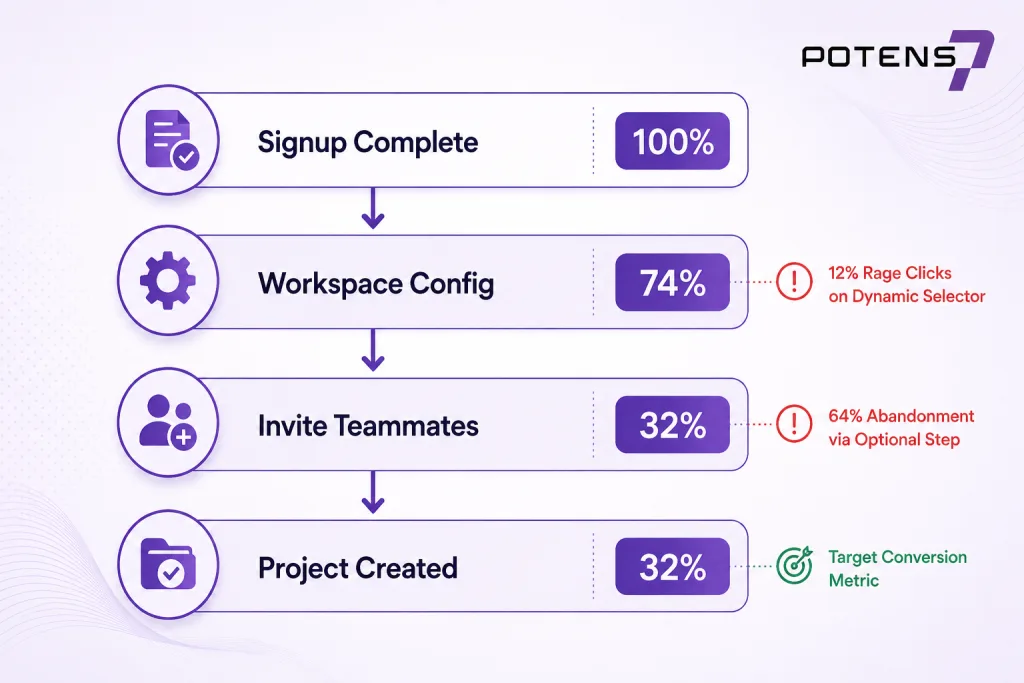
A growth-stage SaaS company noticed a sharp drop-off during user onboarding – 68% of trial users dropped out before setting up their first dashboard project.
Action Plan
- Funnel Identification – Using Mixpanel, the marketing team isolated the drop-off stage, identifying that 64% of drop-outs occurred on step two (“Invite Teammates”).
- Qualitative Replay Diagnostics – The team set up Microsoft Clarity and filtered recordings specifically for sessions hitting step two with frustration flags. The replays revealed that users kept clicking a non-responsive UI button, generating repeated rage clicks.
- A/B Test Execution – The team redesigned the onboarding flow by making the teammate invitation step optional and removing the unresponsive UI element.
Results
- Onboarding Completion Rate – Increased from 32% to 54% within 30 days.
- Time-To-First-Value – Reduced by 4.5 minutes per user.
- Trial-to-Paid Conversion – Yielded an 18% uplift in MRR conversion over a 90-day cycle.
How to Choose the Right User Behaviour Analytics Tool
Selecting the right software platform depends on your operational priorities and technical requirements:
- Define Primary Outcomes – If your core goal is quick UX debugging on landing pages, select visual tools like Microsoft Clarity or Crazy Egg. If you are focused on optimizing product features or retention, choose Mixpanel or Amplitude.
- Evaluate Technical Resources – Tools like Google Analytics 4 and Contentsquare require ongoing tag configuration. Lightweight options like PostHog offer quick auto-capture setups.
- Review Budget vs. Traffic Scale – Pay close attention to pricing models based on Monthly Tracked Users (MTUs) versus raw daily sessions. This prevents sudden cost increases as your site traffic scales.
How to Implement User Behaviour Tracking Tools
To deploy a tracking platform effectively:
- Establish a Data Governance Taxonomy – Standardize event naming conventions (e.g., using a clear structure like object_action → cta_button_clicked) across your analytics suite.
- Deploy Tag Managers Safely – Install platform scripts using Google Tag Manager or a unified customer data platform (CDP) like Segment. Ensure scripts load asynchronously to protect page loading performance.
- Configure PII Redaction Rules – Verify that automated data masking is active across all input fields, login forms, and checkout steps before publishing tracking tags.
- Connect Qualitative & Quantitative Platforms – Link event tracking software (such as GA4 or Mixpanel) with visual tools (like Microsoft Clarity or Hotjar) to view corresponding session replays for major conversion drop-offs.
Frequently Asked Questions (FAQs)
What is user behaviour?
User behaviour encompasses all digital actions, interactions, navigation patterns, and decisions made by a visitor while navigating a website, web app, or mobile software application.
What is user behaviour tracking?
User behaviour tracking is the systematic collection and analysis of behavioural interaction data, such as clicks, mouse paths, form entries, scroll depths, and conversion steps, to measure user engagement and optimize user experience.
What are key user behaviour metrics?
Key metrics include:
- Conversion Rate – The percentage of visitors completing a target goal.
- Rage Click Rate – The frequency of rapid, repeated clicks on non-responsive elements, signalling user frustration.
- Scroll Depth – The vertical percentage of a webpage viewed before leaving.
- Feature Adoption Rate – The percentage of active users engaging with a specific tool or workflow.
- Drop-Off Rate – The percentage of users abandoning a multi-step conversion funnel.
What types of user behaviour analytics data can you track?
You can track quantitative data (click counts, event conversions, page latency), qualitative data (session replays, visual heatmaps), and direct attitudinal data (on-page surveys and NPS responses).
How do you analyze user behaviour in SaaS?
SaaS behavioural analysis focuses on tracking event metrics through onboarding funnels, monitoring daily active user (DAU) to monthly active user (MAU) engagement ratios, and mapping usage cohorts to identify power-user actions that correlate with long-term retention.
Your Digital Growth Partner
Choose Tools For Business Goals
The best tracking platform is not always the one with the longest feature list. Choose based on the outcomes that matter most, whether improving conversions, understanding product adoption, reducing churn, or optimizing customer journeys.

